
NUTRITION INFORMATION PANEL ON FOOD PACKAGING
The Nutrition Information Panel (NIP) on packaged food tells you what nutrition is in the food and also allows you to check nutritional claims on the package.
It also tells you the manufacturers serving size relating to the percentages of nutrients per serving. This is important as different manufacturers will have different serving sizes which makes direct comparisons more difficult.
See if the serving size is realistic – weigh out the serving size and see if you would eat less or more.
The NIP must have three columns. The first column lists the Kilojoules/Calories followed by the nutrients. The second column lists the quantities per serving (see above re serving size) and the third column lists the figures per 100g of food (a percentage!). This third column is the one to use if you want to compare brands. (Some may have a fourth column, with the % daily intake per serving however this is an average figure so may not apply to you!)
The list will comprise Energy, Protein, Fat, Carbohydrates, Sodium (may include fibre) and must include any added vitamins, minerals, additives etc.
Fat will be listed as total fat and will also show saturated fat separately (some will show all types of fat separately).
Carbohydrate includes starches (from flour, potato, grains) and sugars (from fruit, milk, added sugar, honey, agave etc). A separate line must appear for sugars. This is not just added sugar, but both natural and added.
Sodium is a component of salt and appears in milligrams. Sodium intake has been linked to high blood pressure and therefore it is shown on the NIP.
The Per 100 g column are really percentages, so 80 grams of carbohydrates means the food is 80% carbohydrate. Say you wanted to increase the fibre in your diet and you wanted to check some museli brands, this is the column you would look at. For each brand the fibre would be listed per 100g. So if fibre was listed on one as 65g (65%) and another was 75g (75%) this makes it much easier to compare between them.
Companies are required show additional nutrient information such as fibre, vitamins and minerals if making a health claim on the front, for example, a juice with added Vitamin C would have to list Vitamin C on the NIP.
What would be considered high per 100g? (Bear in mind these are general percentages and do not take into account specific dietary requirements)
Protein 12% or more
Fat 20% or more and Saturated Fat 20% or more of total fat
Carbohydrate 60% or more with Sugars being more than 20%
of total Carbohydrate
Fibre 7% or more
Sodium 600 mg or more
What would be considered low per 100g?
Protein 1% or less
Fat 3% or less with 1.5% or less of saturated fat
Carbohydrate 7.5% or less with Sugars being 5% or less.
Fibre .5% or less
Sodium 120mg or less.
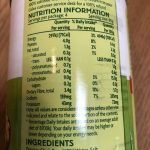 So for example in these photos, based on the above high and low ranges, the Chickpeas would be considered low in fat as total fat is 2.2% and they would be a good source of protein and fibre (not high, but good). Again based on the above, these Organic Oat Clusters, whilst the packaging is full of feel good blurbs, would be considered high in fibre at 9.7% but would also be considered high in fat at 20.3% and high in sugar at 20.3%.
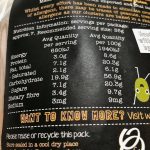
This is why I think it is so important to read the ingredients and not rely on the feel good packaging (more about this next time).
I looked at the following websites for the information above if you want to do more research! http://www.foodstandards.gov.au/Pages/default.aspx
https://ec.europa.eu/…/labelling_n…/labelling_legislation_en